Compare 3 real estate agents in Hyland Park, NSW 2448
Learn more about Hyland Park agents
3 agents in Hyland Park on our panel
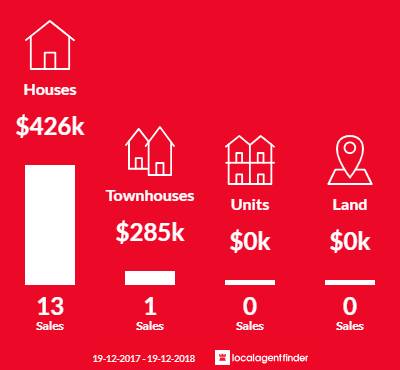
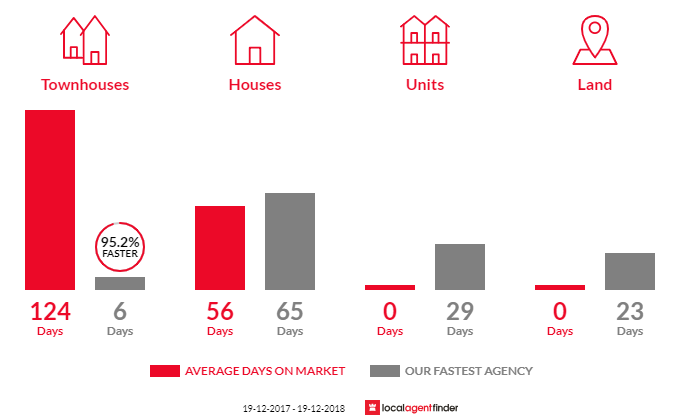
There are 3 real estate agents in Hyland Park to compare at LocalAgentFinder. The average real estate agent commission rate is 0.00%. In Hyland Park over the last 12 months, there has been 11 properties sold, with an average sale price of $735,457. Properties in Hyland Park spend an average time of 108.27 days on the market.
110
Number sold
30
Current listings
88
Avg. days on market
848k
Median price
50
Number sold
17
Current listings
76
Avg. days on market
936k
Median price
2
Number sold
2
Current listings
296
Avg. days on market
621k
Median price
Knowing the agent's fees, commissions and performance in your suburb before you meet them puts you in a great position to negotiate. LocalAgentFinder's leading online comparison platform, selling guide and agent questionnaire gives you access to this information and much more.
Why use LocalAgentFinder?
LocalAgentFinder's leading digital comparison service allows you to compare agent fees & commissions, agent bios, agency information, selling strategies, sales performance, reviews and more.
Average sales prices and volume of sales in Hyland Park

Average days on market vs fastest agency in Hyland Park

Understanding how much selling your property will cost you is made easier with LocalAgentFinder's leading online comparison service that provides you access to agent commission rates, marketing fees, unique selling strategies and more.
The most common type of property sold in Hyland Park are houses with 90.91% of the market, followed by townhouses.
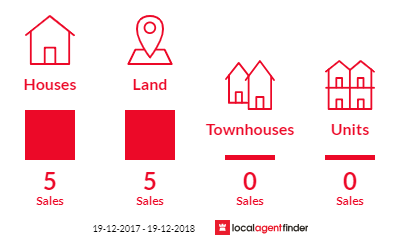
Current agents listings in Hyland Park

When you compare agents with LocalAgentFinder, you can compare 3 agents in Hyland Park, including their sales history, commission rates, marketing fees and independent homeowner reviews. We'll recommend the top three agents in Hyland Park, and provide you with your extended results set so you have the power to make an informed decision on choosing the right agent for your Hyland Park property sale.